Chart statistics |
There are some chart components that support field statistics. That is to say group the attribute fields used in charts, and perform statistics on attribute values in each group in assigned statistical mode. You can perform statistics on multiple attribute fields in one chart.
After statistics, the chart component can be linked with the map component by interaction. That is to say, if you select a group in the chart, the elements in the group will be highlighted in the map.
The following chart components support statistics: histogram, bar, pie, scatter, line, radar, etc. The statistical modes include summation, maximum, minimum, average, mode, median, variance, standard deviation, etc.
To compile statistics in the chart component, click 'Components' > 'Chart' in the left sidebar, and drag a chart component that supports statistics to the dashboard, such as the bar component. Then select the component, perform the following settings in the right attribute panel:
Take the following chart as the data source of the bar component, and select 'Country' as X-axis field, select 'Boat num' as Y-axis field. Then perform statistics in 'Sum' statistic mode.
These operations aim to sum the number of boat for each country. The bar before statistics can be seen in Figure 1, and bar after statistics can be seen in Figure 2.
Table 1 Data source of the bar component
| Country | Area num | Area name |
Boat num |
|
China |
1 |
Beijing |
1 |
|
China |
2 |
Shanghai |
2 |
|
China |
3 |
Guangzhou |
3 |
|
Russia |
1 |
Moscow |
1 |
|
Russia |
2 |
Saint Petersburg |
6 |
|
USA |
1 |
New York |
1 |
Figure1:before statistics Figure2:after statistics
You can link chart statistics to maps if chart component and the map component contain the same data or the data between the components can be associated through a certain field. For example, select a group in the chart statistics, the elements in the group will be highlighted in the map. Follow these steps to create interaction to link chart statistics and map.
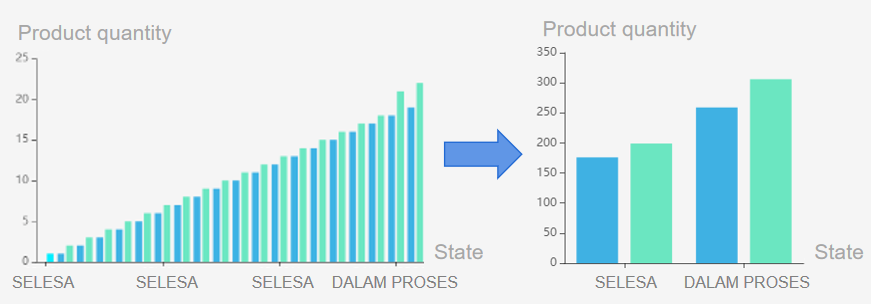
Take the following chart as an example. Group the X-axis attribute 'Status' and perform statistics on 'sum' statistic mode. The bar before statistics can be seen in Figure 3, and bar after chart statistics can be seen in Figure 4. Select a group in the bar, the elements in the group will be highlighted in the map.
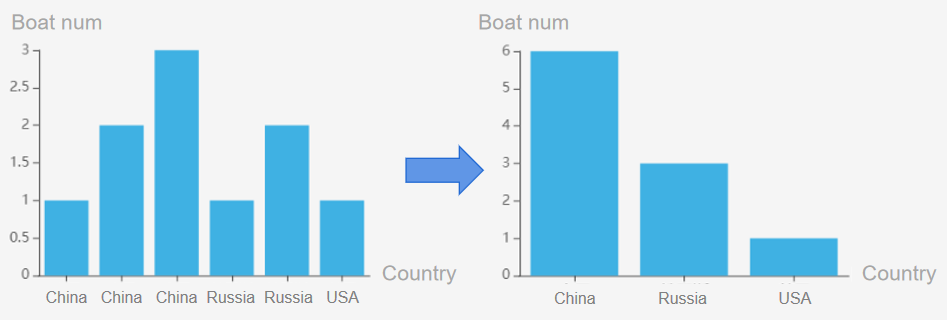
Figure3: before statistics Figure4: after statistics
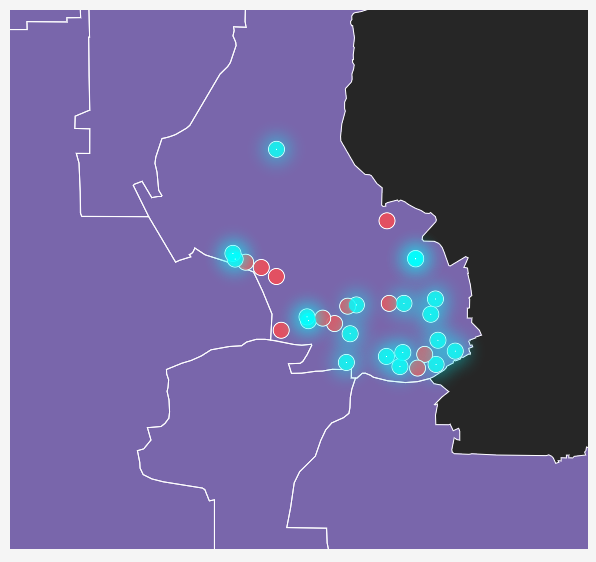
Figure5: highlight elements in the group