数据上图WebApp扩展定制点线符号集示例 |
数据上图 WebApp 支持扩展定制点、线符号集,满足用户对矢量图层中使用的点、线样式的个性化需求。扩展定制的点样式可应用于基本、单值、等级符号等点图层样式,扩展定制的线样式可应用于基本的线图层样式。
本节将以扩展一个线符号集Tab标签页和两个线符号为例详细介绍扩展开发。
第一步:
在配置文件symbol-line.json(在【iPortal 产品包】 /webapps/iportal/WEB-INF/lib/ 路径中找到并解压 webjar-dataviz-*.jar,在解压目录/META-INF/resources/apps/dataviz/libs/plugins 可获取此文件)中添加新的线符号集标签页“水体”,代码如下粗体所示:
{
"traffic": { ...
},
//添加新的线符号集水体
"water": {
"label": "水体",
"items": [
]
}
}
第二步:
在标签页“water”下的“items”中添加两个新的线符号“普通河流”和“时令河流”,代码如下所示:
{
"traffic": { ...
},
//添加新的线符号集“水体”
"water": {
//添加新的线符号“普通河流”
"label": "水体",
"items": [
{
"id": "normal river",
"label": "普通河流",
"thumbnail": "static/imgs/layer_editor/lineType/dark/river.svg",
"styleConfigs": [
{
"strokeColor": {
"label": "线颜色",
"controlType": "color"
},
"strokeWidth": {
"label": "线宽度",
"controlType": "number"
},
"strokeOpacity": {
"label": "线不透明度",
"controlType": "percent"
},
"lineCap": {
"label": "线端点样式",
"controlType": "select"
}
}
],
"styles": [
{
"strokeColor": "#c2e2f0",
"strokeWidth": 1.82,
"strokeOpacity": 1,
"lineCap": "butt"
}
]
},
//添加新的线符号“时令河流”
{
"id": "riverSeason",
"label": "时令河流",
"thumbnail": "static/imgs/layer_editor/lineType/dark/riverseason.svg",
"styleConfigs": [
{
"strokeColor": {
"label": "间隔线颜色1",
"controlType": "color"
},
"strokeWidth": {
"label": "间隔线宽度1",
"controlType": "number"
},
"strokeOpacity": {
"label": "间隔线不透明度1",
"controlType": "percent"
},
"lineCap": {
"label": "间隔线线端点样式1",
"controlType": "select"
}
},
{
"strokeColor": {
"label": "间隔线颜色2",
"controlType": "color"
},
"strokeWidth": {
"label": "间隔线宽度2",
"controlType": "number"
},
"strokeOpacity": {
"label": "间隔线不透明度2",
"controlType": "percent"
},
"lineCap": {
"label": "间隔线线端点样式2",
"controlType": "select"
}
}
],
"styles": [
{
"strokeColor": "#c2e2f0",
"strokeWidth": 4.16,
"strokeOpacity": 1,
"lineCap": "round"
},
{
"strokeColor": "#ffffff",
"strokeWidth": 3,
"lineDash": [13.23, 13.23],
"strokeOpacity": 0,
"lineJoin": "round",
"lineCap": "butt"
}
]
}
]
}
}
第三步
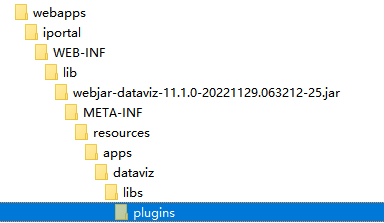
将symbol-line.json重新压缩到路径【iPortal 产品包】/webapps/iportal/WEB-INF/lib/webjar-dataviz-*.jar 中(位置:/META-INF/resources/apps/dataviz/libs/plugin/),结构如下所示。

第四步
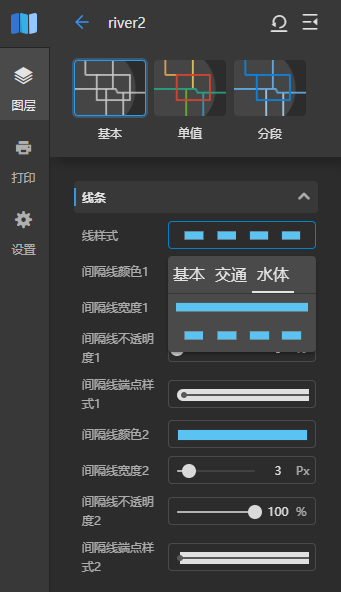
在浏览器中访问 iPortal,登录后,从导航栏“应用中心”下的页面左侧进入“数据上图”,添加并打开任一线图层,可在“图层”面板中“基本”选项卡下的“线样式”中,使用并查看线符号集的扩展效果。
“水体”线符号集扩展效果:

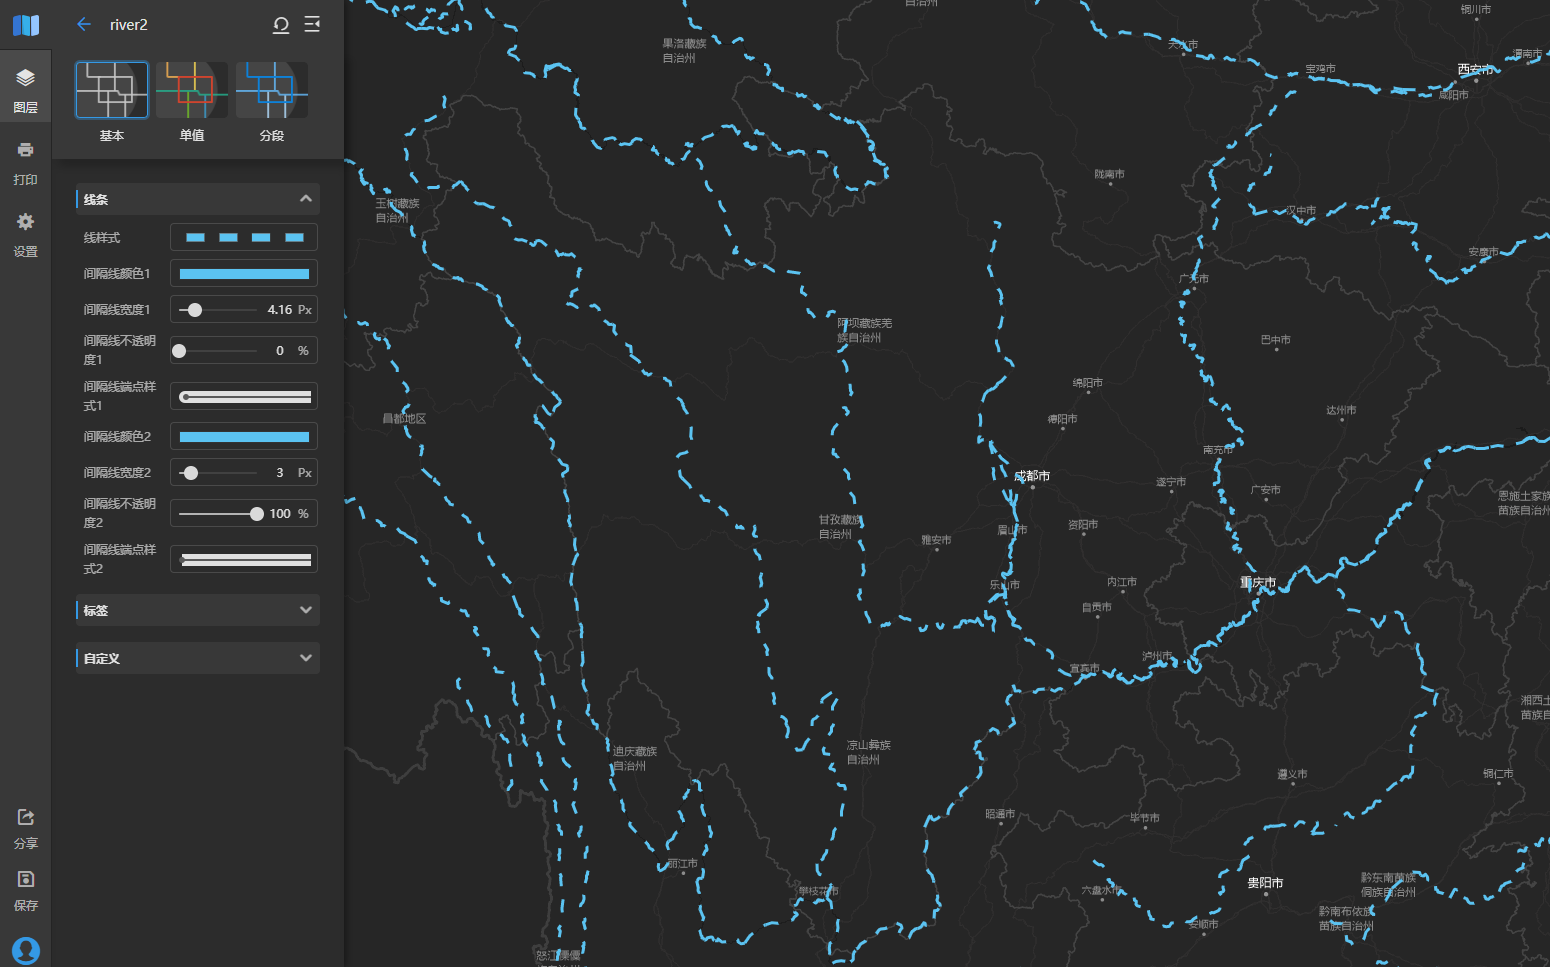
“时令河流”线符号上图效果:
